Mapping weather
Early weather mapping in New South Wales
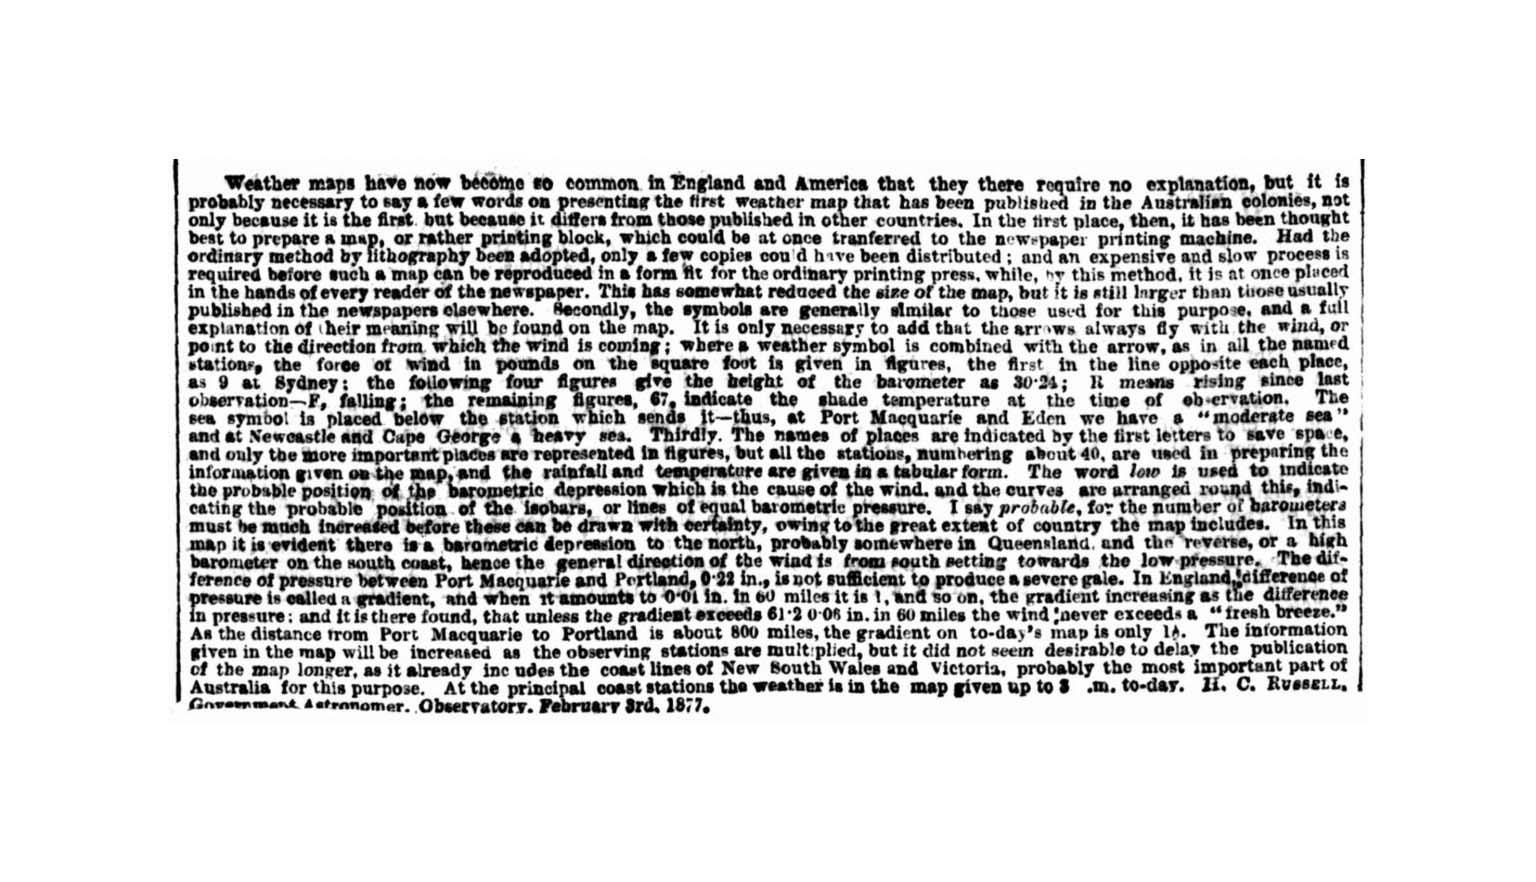
In 1877, meteorologist and astronomer Henry Russell produced the first published weather map for the colony of New South Wales. He gathered information from weather stations across the colony and combined it with data from the Sydney Observatory. The map provided detailed information for individual stations and towns, including isobars and other meteorological symbols.
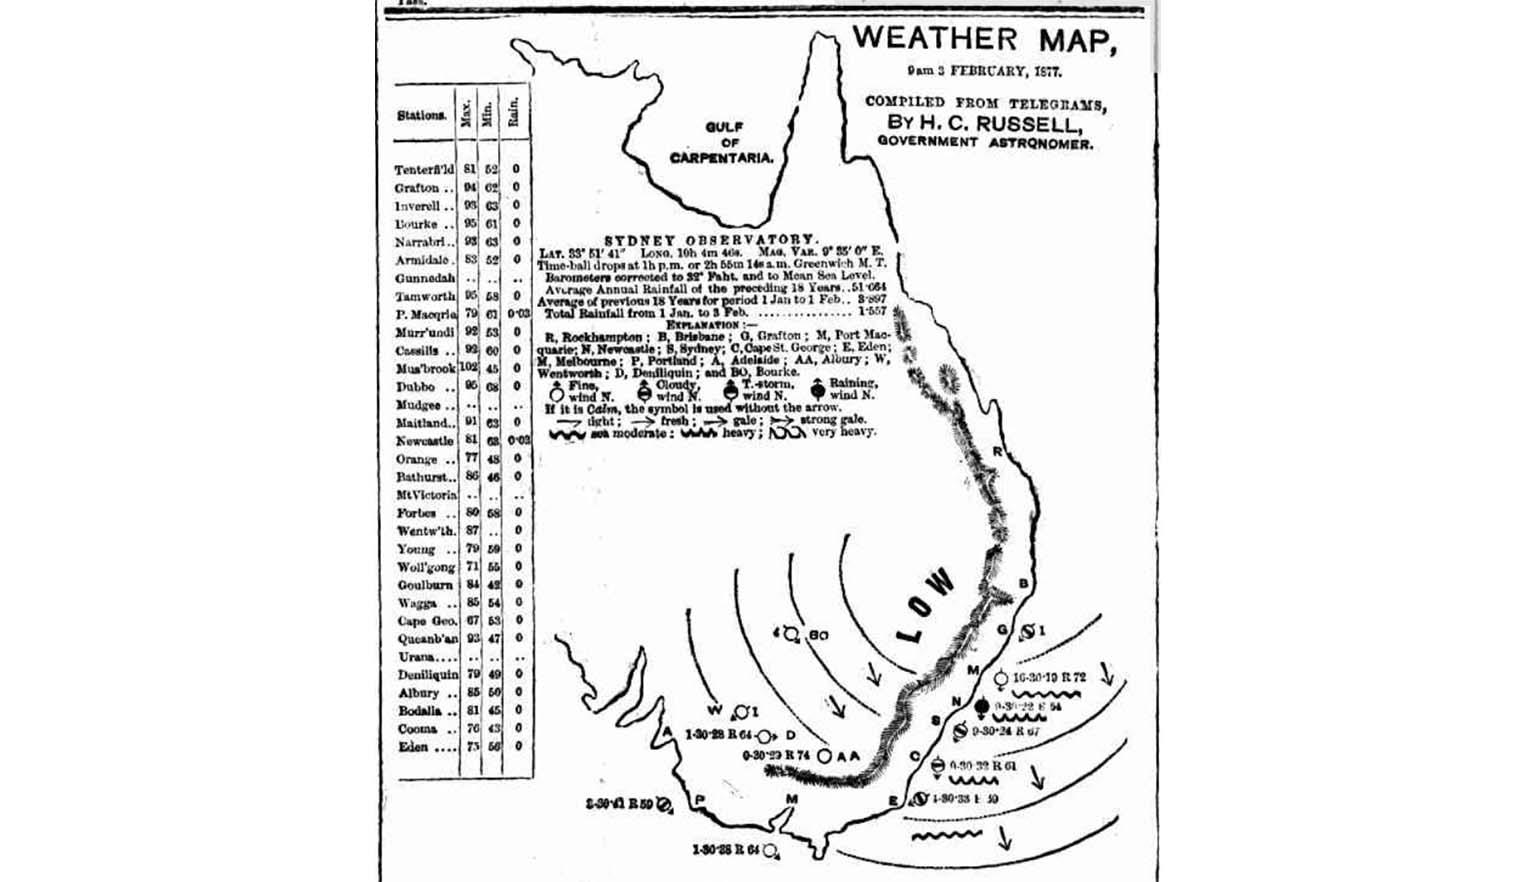
WEATHER MAP, 9 am 3 FEBRUARY, 1877, The Sydney Morning Herald (NSW : 1842 - 1954), p. 6, 5 February 1877, nla.gov.au/nla.news-article13389140
WEATHER MAP, 9 am 3 FEBRUARY, 1877, The Sydney Morning Herald (NSW : 1842 - 1954), p. 6, 5 February 1877, nla.gov.au/nla.news-article13389140
WEATHER MAP, 9 am 3 FEBRUARY, 1877. (1877, February 5). The Sydney Morning Herald (NSW : 1842 - 1954), p. 6. nla.gov.au/nla.news-article13389140
WEATHER MAP, 9 am 3 FEBRUARY, 1877. (1877, February 5). The Sydney Morning Herald (NSW : 1842 - 1954), p. 6. nla.gov.au/nla.news-article13389140
Learning activities
Activity 1: Understanding weather maps
Weather maps, also called synoptic charts or surface charts, use symbols to show weather systems and phenomena clearly. Work with the class to learn how to read these maps by completing the following tasks:
- List the symbols for rain, snow, sleet and hail
- Identify symbols for high (H) and low (L) pressure systems, cold fronts, warm fronts, occluded fronts and stationary fronts
- Discuss the effects these systems have on the weather we experience
- Research and draw symbols for wind speed
- Research and draw isobars
Once students are familiar with the symbols, have the class collectively construct a surface chart on the wall. Each student can add a different weather symbol. Discuss as a group what kind of weather the map indicates for the day.
More to explore