Australia's wild weird wonderful weather
About this module
Designed to give teachers flexibility and develop student skills, the content of this module is based on Stephanie Owen Reeder and Tania McCartney book, Australia’s Wild Weird Wonderful Weather (NLA Publishing, 2020).
The resource also has relevance to the general capabilities of literacy, critical and creative thinking, intercultural understanding, and personal and social capability.
Copyright for teachers
You can download all collection materials in this resource for education purposes. For more information, go to copyright for teachers.
Topics in this module
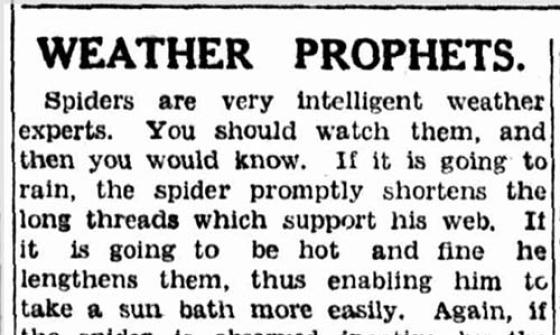
WEATHER PROPHETS, The Age (Melbourne, Vic. : 1854 - 1954), p. 17, 4 November 1937 nla.gov.au/nla.news-article205560442
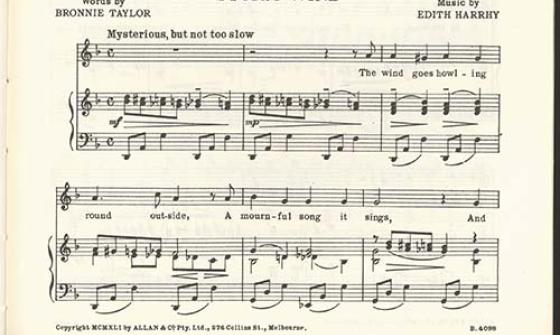
Edith Harrhy and Bronnie Taylor, Songs for young Australians [music] / words by Bronnie Taylor ; music by Edith Harrhy, 1941, nla.gov.au/nla.obj-175231656
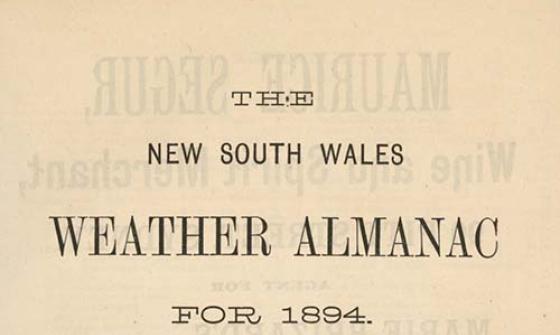
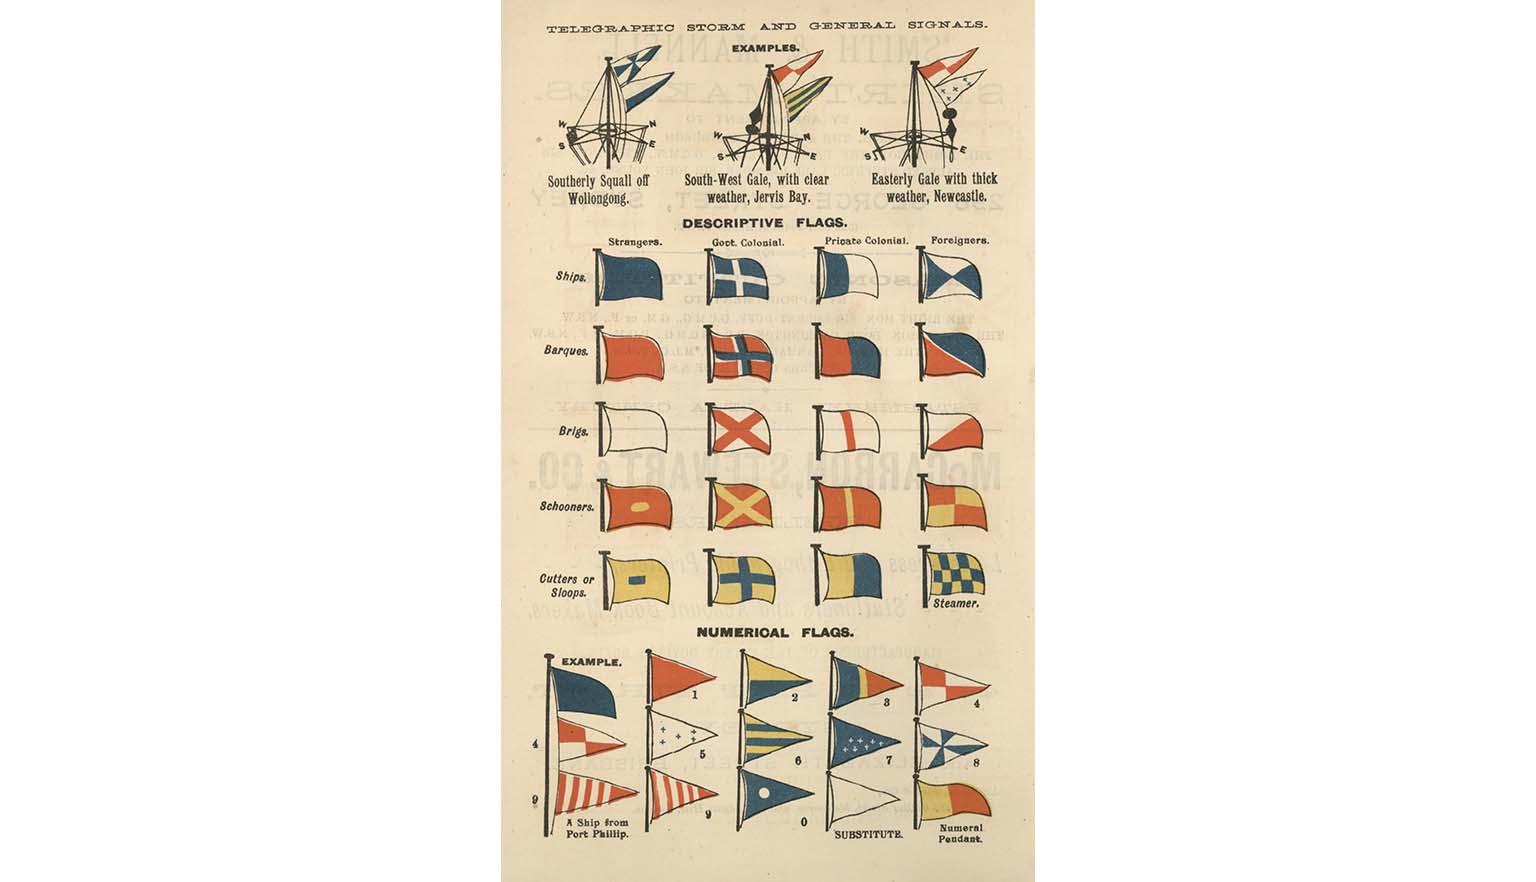
New South Wales weather almanac for ... : a general handbook for the year, 1894, nla.gov.au/nla.obj-406743496
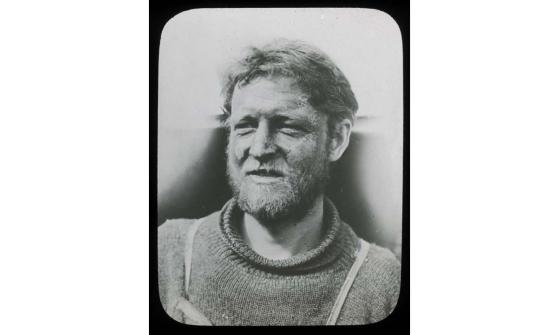
Frank Hurley, Madigan's frostbitten face, Adelie Land [Australasian Antarctic Expedition, 1911-1914], nla.gov.au/nla.obj-145067660
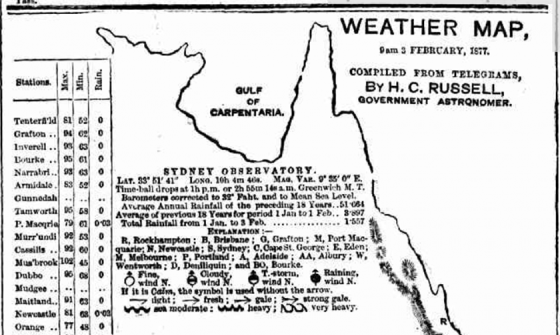
WEATHER MAP, 9 am 3 FEBRUARY, 1877. (1877, February 5). The Sydney Morning Herald (NSW : 1842 - 1954), p. 6. nla.gov.au/nla.news-article13389140
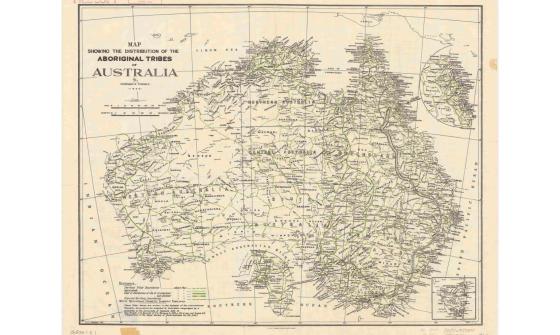
Norman B Tindale, Map showing the distribution of the Aboriginal tribes of Australia, 1940, nla.gov.au/nla.obj-230054338
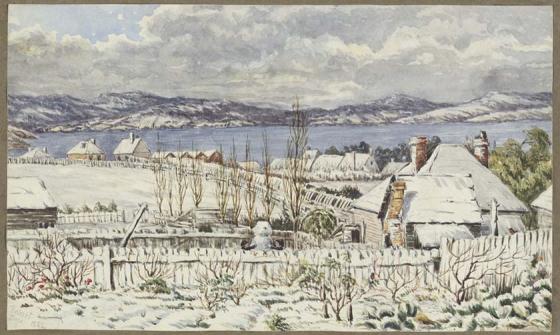
HJ Graham, Severe snow storm over Hobart, 1882, nla.gov.au/nla.obj-135529606
Introductory activities
These activities are designed to introduce key ideas and themes relevant to HASS: Geography and Science. They help students begin thinking about weather in Australia before engaging with National Library collection material in each theme.
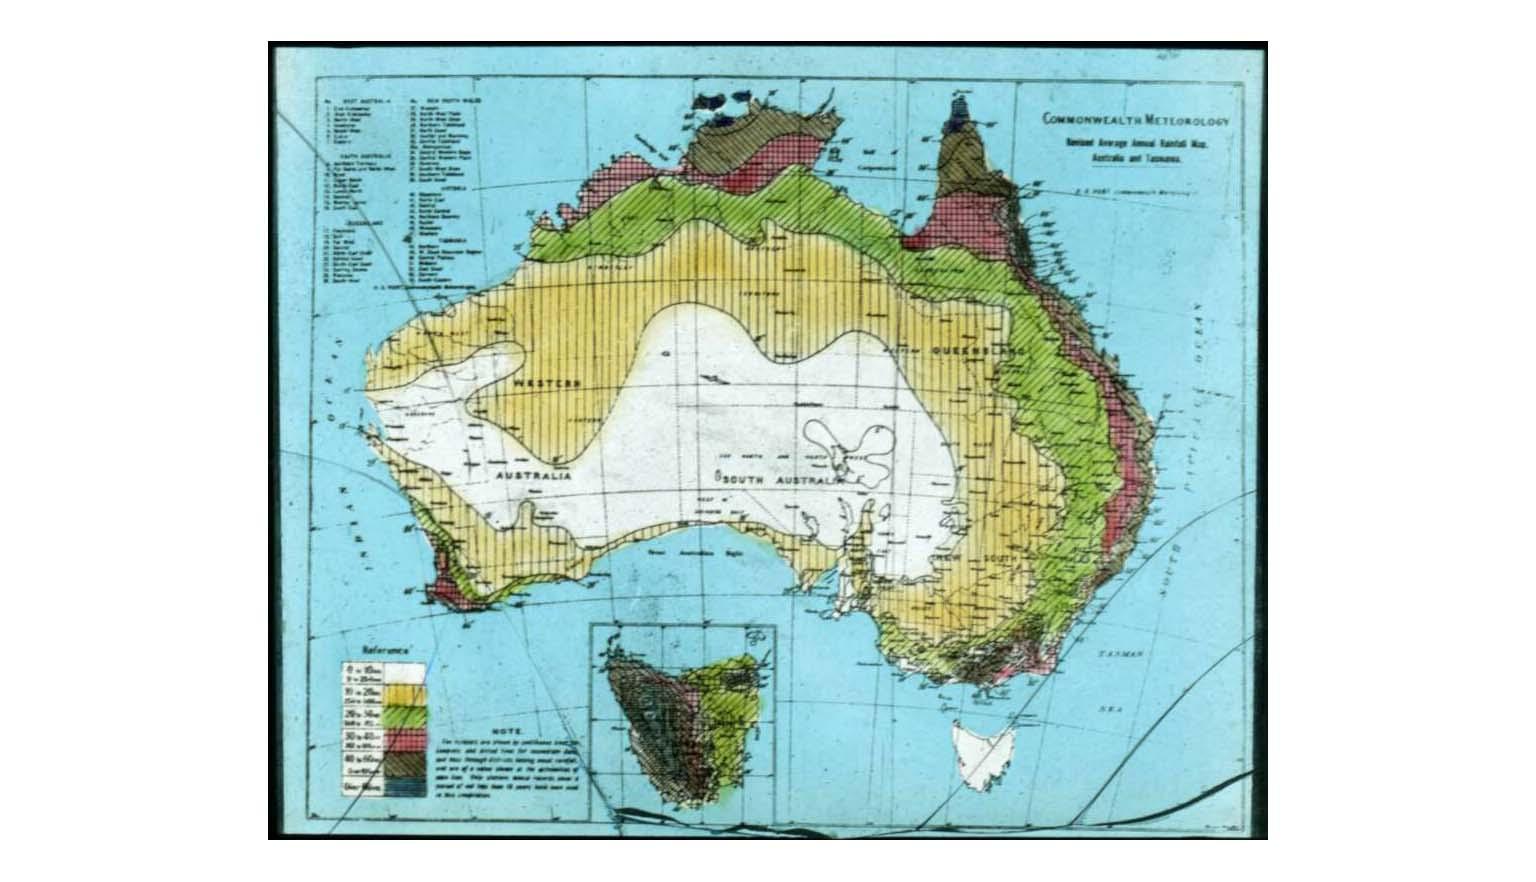
HA Hunt and Commonwealth Bureau of Meteorology (Australia), Revised average annual rainfall map, Australia and Tasmania [transparency], 1920, nla.gov.au/nla.obj-142324647
HA Hunt and Commonwealth Bureau of Meteorology (Australia), Revised average annual rainfall map, Australia and Tasmania [transparency], 1920, nla.gov.au/nla.obj-142324647
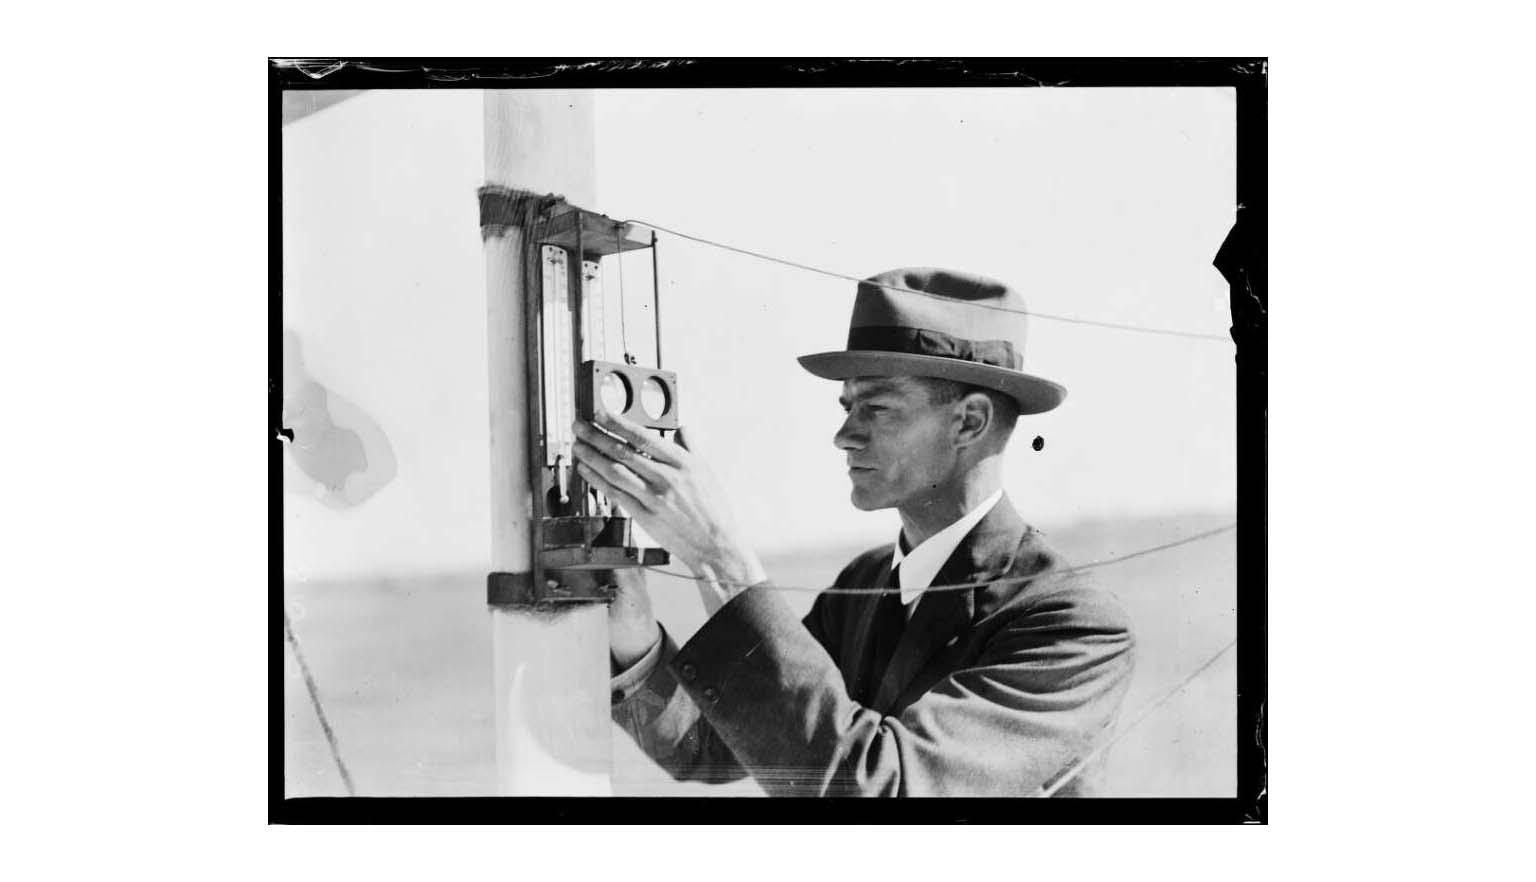
Fairfax Corporation, Meteorologist Edward Timcke reading the temperature on thermometers at the Bureau of Meteorology, New South Wales, 1920, nla.gov.au/nla.obj-161044970
Fairfax Corporation, Meteorologist Edward Timcke reading the temperature on thermometers at the Bureau of Meteorology, New South Wales, 1920, nla.gov.au/nla.obj-161044970
New South Wales weather almanac for ... : a general handbook for the year, 1894, nla.gov.au/nla.obj-406743496
New South Wales weather almanac for ... : a general handbook for the year, 1894, nla.gov.au/nla.obj-406743496
Activity 1: Reading the clouds
As a class, create a chart to record:
- the main cloud types
- the days of the week (Monday to Friday)
- the weather observed each day
At the end of each school day, record the types of clouds seen and the weather experienced.
Discuss how the cloud types corresponded to the day’s weather.
Activity 2: Cycle of life
Explore the water cycle by discussing:
- where moisture in the air comes from
- how it moves through the environment
- the processes of evaporation and condensation
Conduct the following experiments:
- Transpiration test: Place a clear plastic bag over tree leaves on a sunny day and observe after one hour.
- Evaporation test: Leave different-sized containers with the same amount of water in the sun. Observe how long the water takes to evaporate.
- Condensation test: Tie a plastic sheet between poles with a stone in the centre and a measuring cup underneath. Leave overnight and measure the collected water.
Discuss the implications of each result.
Activity 3: What about me?
Have the class create a mind map exploring how weather affects their daily lives. Encourage students to include:
- positive effects (for example, going swimming on hot days)
- negative effects (for example, rain cancelling sports events)
- neutral effects (for example, wearing different clothes)
Ask students to illustrate their mind maps using stock photos sourced online.
Activity 4: Talking about the weather
Choose five common weather-related sayings (for example, ‘raining cats and dogs’, ‘every cloud has a silver lining’, ‘breaking the ice’, ‘right as rain’, ‘fair-weather friend’).
In small groups, students will:
- research each saying’s origin and meaning
- create a poster or brochure illustrating and explaining the sayings
Concluding activities
Activity 5: Everyday actions to combat climate change
As a class, discuss what students can do on a daily basis to help slow down climate change. Examples may include:
- recycling to help reduce emissions
- cutting down on the use of plastics
- turning off home appliances when not in use
- walking, cycling or using public transport
- buying locally grown food and locally made products
- using a clothes line rather than a tumble dryer
- planting trees to absorb carbon dioxide and produce oxygen
Activity 6: Research energy types
In small groups or individually, have students research, identify and list examples of:
- non-renewable energy (for example, fossil fuels such as coal, oil and natural gas)
- renewable energy (for example, . solar, wind, wave, biofuels)
Activity 7: Energy use at home and school
Discuss the types of energy used both at home and at school. Encourage students to consider:
- where energy is being consumed
- how the use of non-renewable energy might be reduced
- practical solutions for making energy use more sustainable
Activity 8: Design an energy-smart space
Have students create a labelled diagram of a house or their school. The diagram should:
- identify current non-renewable energy sources
- suggest renewable energy sources that could replace them
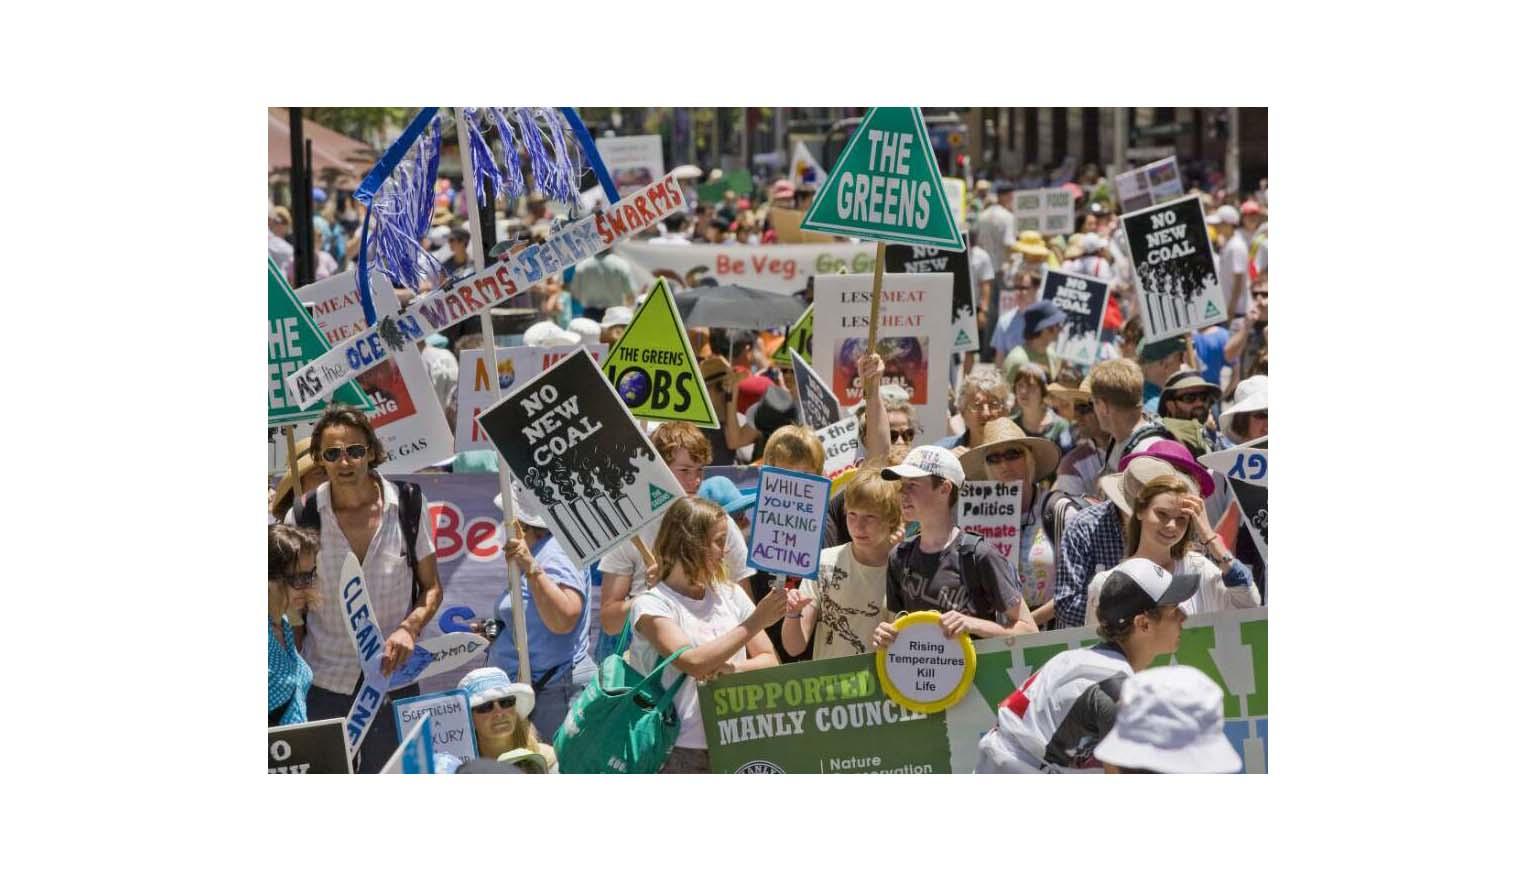
Wendy McDougall, Placards on display during the Walk against warming , Martin Place, Sydney, 12 December 2009, nla.gov.au/nla.obj-138025570
Wendy McDougall, Placards on display during the Walk against warming , Martin Place, Sydney, 12 December 2009, nla.gov.au/nla.obj-138025570
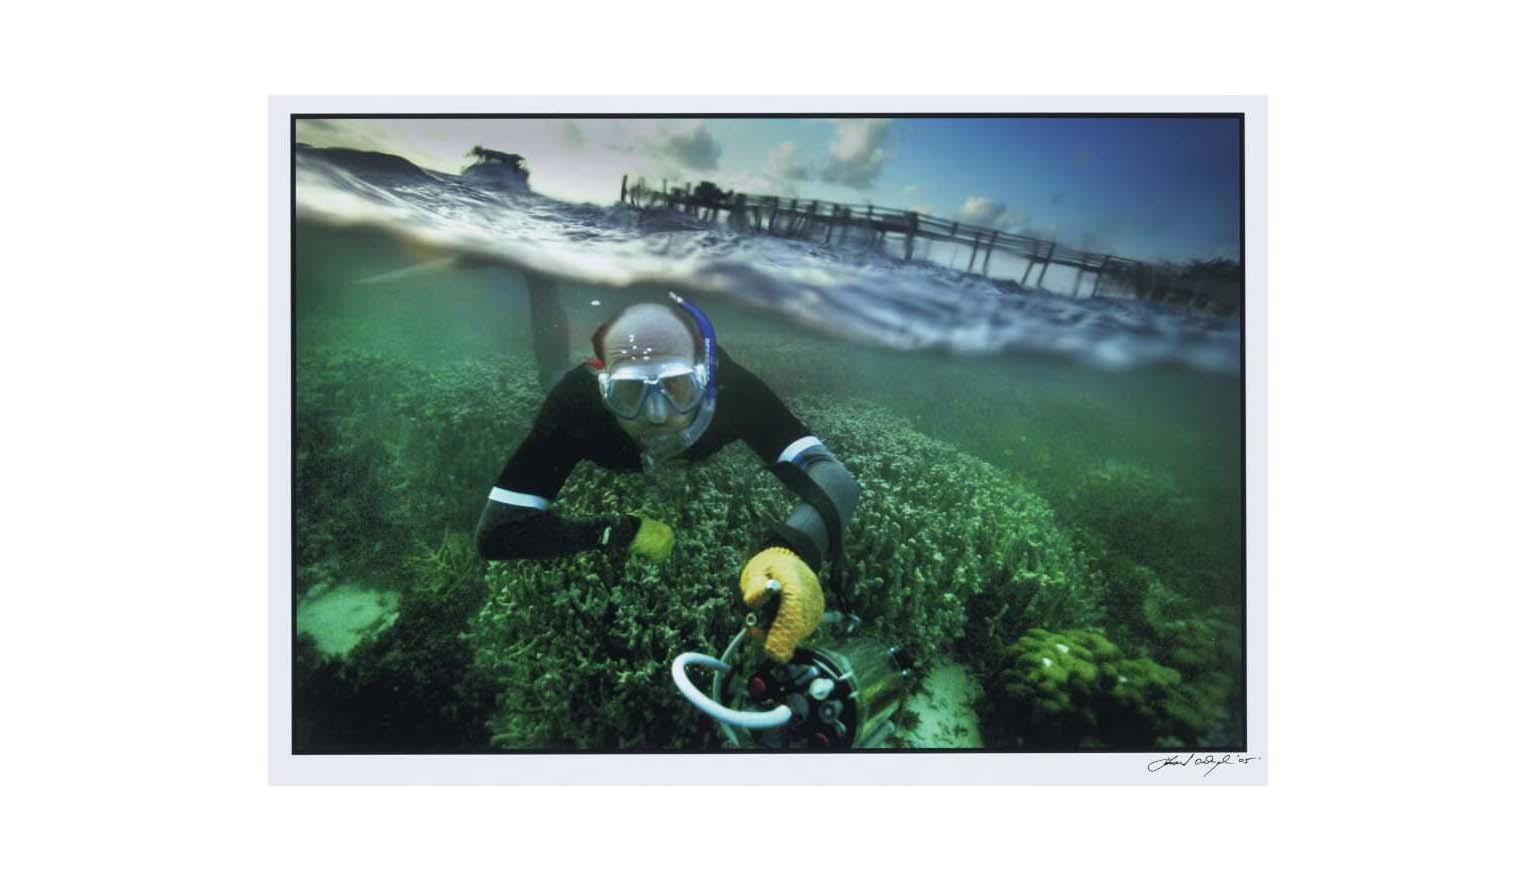
Simon O'Dwyer, Marine botanist Peter Ralph, surveys the reef with a fluorometer to measure stress levels in coral algae, Heron Island, 17 November 2005, nla.gov.au/nla.obj-148451336
Simon O'Dwyer, Marine botanist Peter Ralph, surveys the reef with a fluorometer to measure stress levels in coral algae, Heron Island, 17 November 2005, nla.gov.au/nla.obj-148451336
Curriculum links
This resource has been developed with specific reference to the Australian Curriculum: Humanities and Social Sciences for year 4 and 5 students and the Australian Curriculum: Science for years 4, 5 and 6 students.
- The importance of environments, including natural vegetation and water sources, to people and animals in Australia and on another continent (AC9HS4K05)
- Sustainable use and management of renewable and non-renewable resources, including the custodial responsibility First Nations Australians have for Country/Place (AC9HS4K06)
- Biological sciences: Examine how particular structural features and behaviours of living things enable their survival in specific habitats (AC9S5U01)
- Earth and space sciences: describe how weathering, erosion, transportation and deposition cause slow or rapid change to Earth’s surface (AC9S5U02)
- Processing, modelling and analysing: construct and use appropriate representations, including tables, graphs and visual or physical models, to organise and process data and information and describe patterns, trends and relationships(AC9S5I04)
More to explore